
Learn more about Prometheus
Prometheus is an open-source monitoring and alerting tool that was originally created at SoundCloud in 2012. Since then, it has been widely adopted by many companies and has a strong community of developers and users. In 2016, Prometheus joined the Cloud Native Computing Foundation (CNCF) as its second hosted project, right after Kubernetes, to ensure independent development and governance.
Prometheus works by collecting and storing metrics as time series data. This means each piece of data is recorded with a timestamp and can include optional labels (key-value pairs) for better organization and filtering.
The Prometheus ecosystem has several key parts, but not all are required:
- The main Prometheus server collects and stores time-series data.
- Client libraries help you add monitoring to your apps.
- A push gateway supports short-lived jobs.
- Exporters integrate with services like HAProxy, StatsD, and Graphite.
- The alertmanager handles alerts.
- Various tools provide extra support.
Most components are built in Go, making them easy to deploy as standalone binaries.
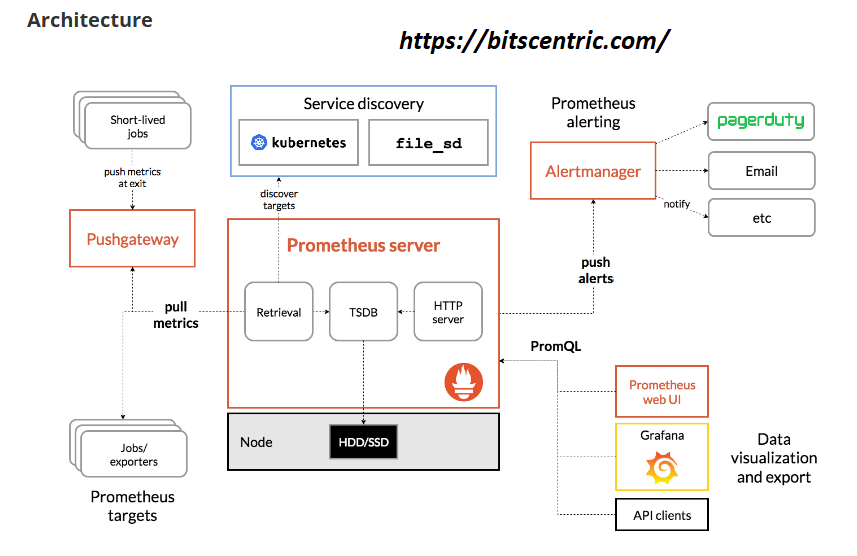
Architecture
Prometheus collects metrics from applications, either directly or through a push gateway for short-lived jobs. It stores this data locally and applies rules to create new time series or trigger alerts. Tools like Grafana can then be used to visualize the data.
This diagram shows how Prometheus is set up and how it connects with other tools in its ecosystem.
Features
Prometheus’s key features:
- Stores time series data with labels (key/value pairs) for better organization.
- Uses PromQL, a powerful query language to analyze data.
- Works independently without needing distributed storage.
- Collects data by pulling from targets over HTTP.
- Supports pushing data through a gateway if needed.
- Finds targets automatically via service discovery or manual setup.
- Offers various ways to visualize data with graphs and dashboards.
What are metrics?
Metrics are just numbers that help us track and understand things. A time series simply means recording changes over time. What you measure depends on what you’re working with. For a web server, it might be how long requests take. For a database, it could be the number of active connections or running queries.
Metrics help explain why your application is behaving a certain way. Imagine your web app is running slow. To figure out why, you need data. If you track the number of requests and see a spike, you might realize the app is struggling under heavy traffic. With that insight, you could add more servers to handle the load and improve performance.
When Does Prometheus Fit?
Prometheus is great for tracking numbers over time, whether it’s system performance or fast-changing services. It’s especially useful in microservices because it collects and queries multi-dimensional data with ease.
Built for reliability, Prometheus is your go-to tool during outages. It runs independently, without relying on network storage or external services. Even when parts of your system fail, Prometheus keeps working—no complex setup needed.