How to setup Prometheus on Ubuntu 22.04
Prometheus is a free, open-source tool for monitoring servers, containers, and applications. It collects and tracks metrics, events, and alerts. With its flexible query language (PromQL), built-in visualization, and alerting system, it helps you stay on top of issues in real time.
Install Prometheus on Ubuntu
# apt update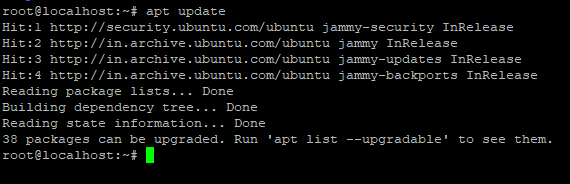
Create a System User for Prometheus
Create a new group for Prometheus, then add a system user to that group.
# groupadd --system prometheus
# useradd -s /sbin/nologin --system -g prometheus prometheus
This creates a system user and group called “prometheus” with restricted privileges, making it safer from unauthorized access.
Create Directories for Prometheus
To keep Prometheus organized, you’ll need to set up a couple of directories—one in /etc for configuration files and another in /var/lib for libraries.
# mkdir /etc/prometheus
# mkdir /var/lib/prometheus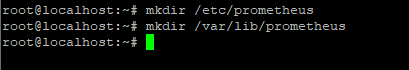
Download Prometheus and Extract Files
# wget https://github.com/prometheus/prometheus/releases/download/v2.53.3/prometheus-2.53.3.linux-amd64.tar.gz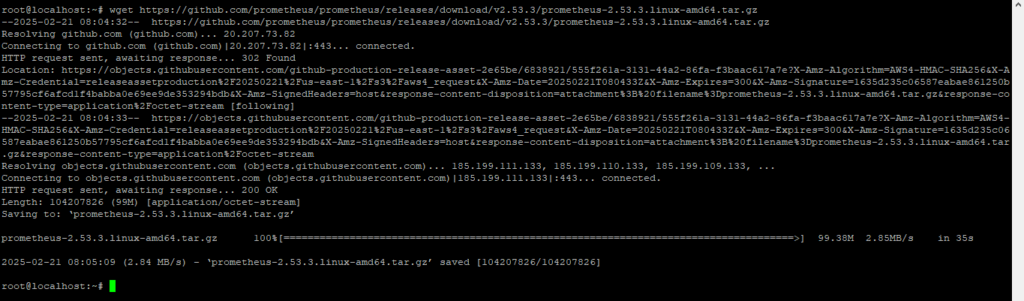
Once the download is complete, run this command to extract the file.
# tar xzfv prometheus-2.53.3.linux-amd64.tar.gz
Configuring Prometheus on Ubuntu
You can now set it up! This includes choosing which metrics to collect, setting up targets for data collection, and configuring alerts and recording rules.
Move the Binary Files & Set Owner
Move the prometheus and promtool files, then set their ownership to the prometheus user and group.
# cd prometheus-2.53.3.linux-amd64/
# ls
# mv prometheus /usr/local/bin/
# mv promtool /usr/local/bin/
# chown prometheus:prometheus /usr/local/bin/prometheus
# chown prometheus:prometheus /usr/local/bin/promtool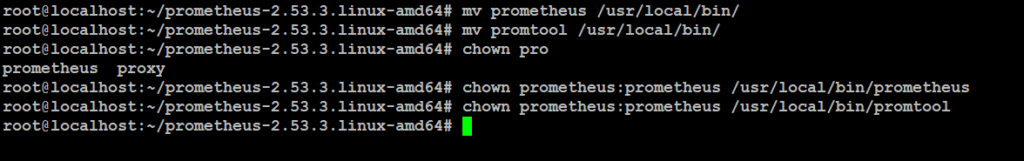
Move the Configuration Files & Set Owner
Next, transfer the configuration files and set the correct ownership so Prometheus can access them properly.
# mv consoles /etc/prometheus/
# mv console_libraries/ /etc/prometheus/
# mv prometheus.yml /etc/prometheus/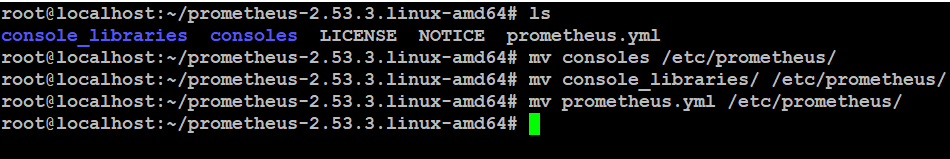
# chown prometheus:prometheus /etc/prometheus/
# chown -R prometheus:prometheus /etc/prometheus/consoles/
# chown -R prometheus:prometheus /etc/prometheus/console_libraries/
# chown -R prometheus:prometheus /var/lib/prometheus/
The prometheus.yml file is the main setup file for Prometheus. It defines what to monitor, how often to collect data, how to process and store it, and where to send alerts.
# vim /etc/prometheus/prometheus.yml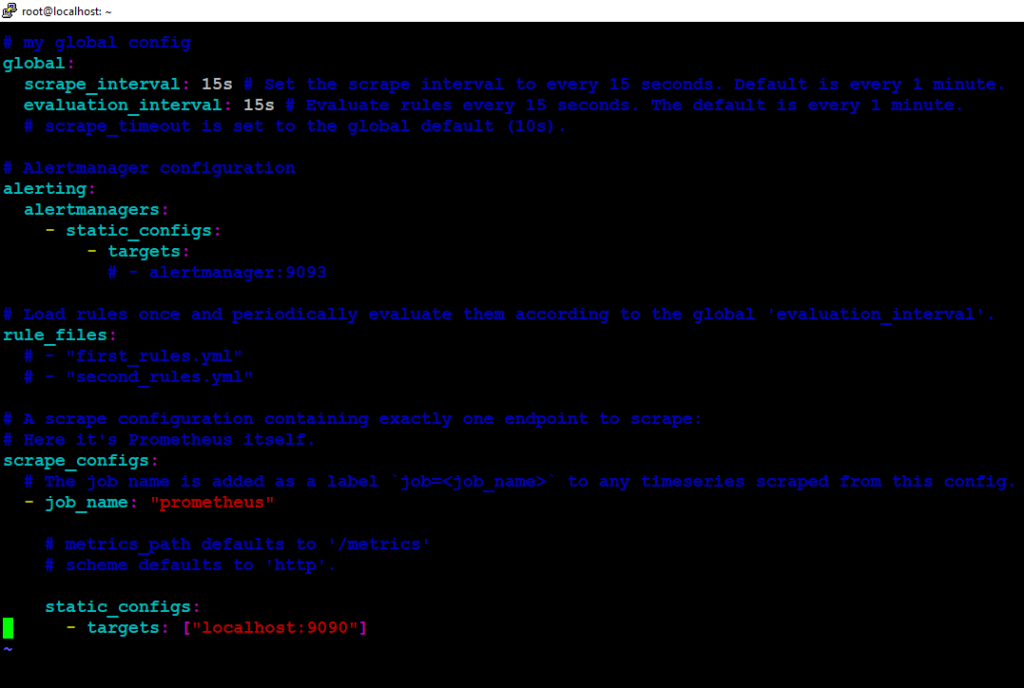
Create Prometheus Systemd Service
You need to create a systemd service file for Prometheus. Open a new file named prometheus.service.
# vim /etc/systemd/system/prometheus.service

[Unit]
Description=Prometheus
Wants=network-online.target
After=network-online.target

[Service]
User=prometheus
Group=prometheus
Type=simple
ExecStart=/usr/local/bin/prometheus \
    --config.file /etc/prometheus/prometheus.yml \
    --storage.tsdb.path /var/lib/prometheus/ \
    --web.console.templates=/etc/prometheus/consoles \
    --web.console.libraries=/etc/prometheus/console_libraries

[Install]
WantedBy=multi-user.target
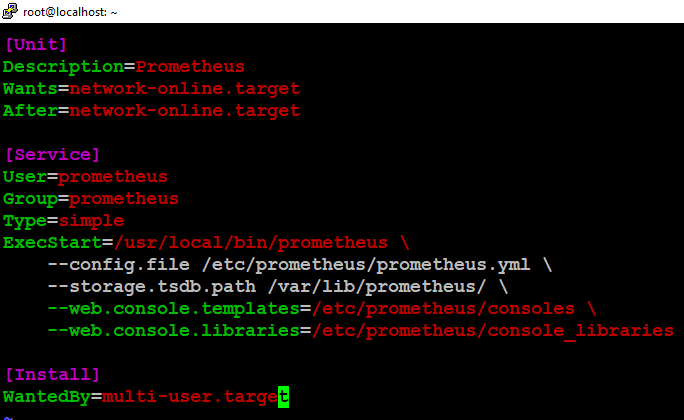
The Prometheus service file on Ubuntu controls how Prometheus runs as a system service. It sets the user and group for the process, defines where the Prometheus binary and config file are located, and specifies where to store metrics data. You can also use it to add extra startup options for Prometheus.
Reload Systemd
After saving the prometheus.service file, reload the system configuration to apply the changes.
# systemctl daemon-reloadStart Prometheus Service
# systemctl enable prometheus
# systemctl start prometheus
# systemctl status prometheus
Access Prometheus Web Interface
Prometheus uses port 9090 by default, so make sure to open it in your firewall.
# ufw allow 9090/tcp
# ufw reload
With Prometheus running successfully, you can access it via your web browser.
# http://localhost:9090 or <ip_address>:9090
# http://192.168.52.128:9090/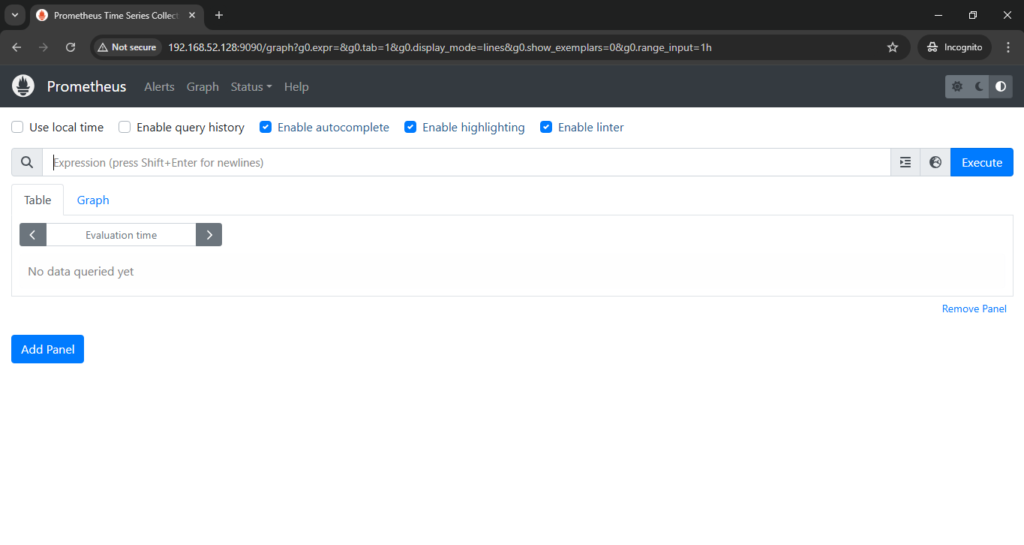
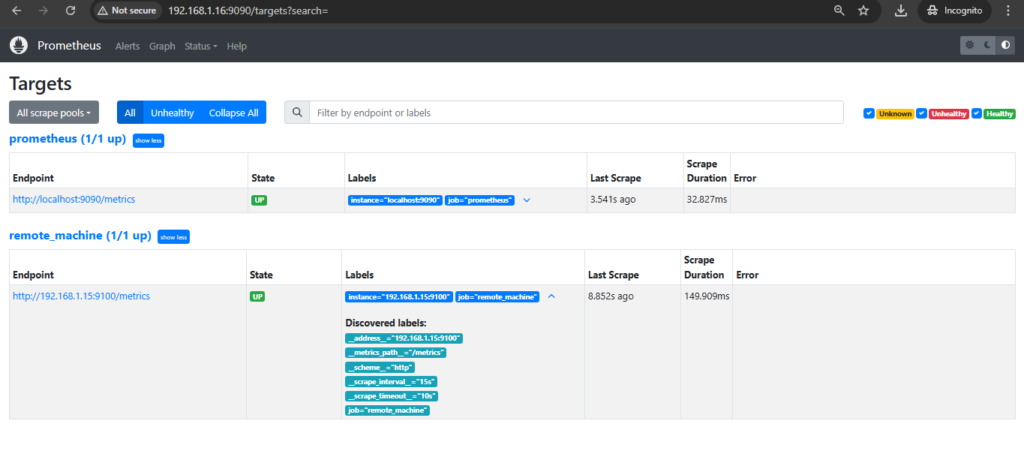
To check status
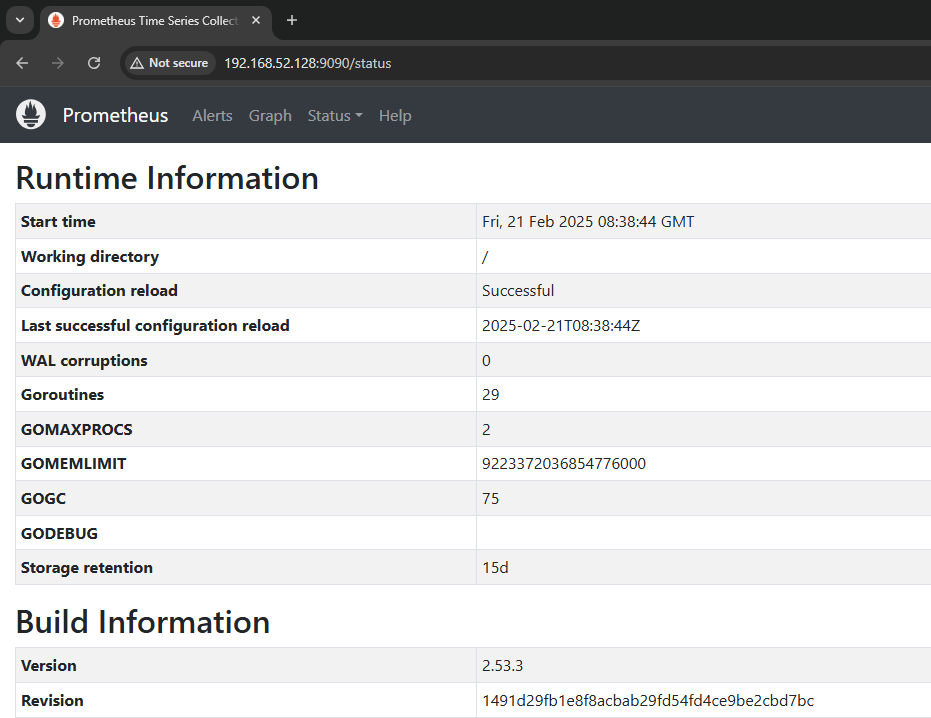
Just like we can view the Prometheus dashboards, we can also check the target status. Here, we can see that the current state is UP, and we can also view the timestamp of the last scrape.

Add client machine