How to setup Node Exporter on Ubuntu 22.04
Node Exporter is a lightweight tool that collects and shares hardware and system metrics, helping you keep an eye on server health. For Windows users, Windows Exporter does the same job.
This guide walks you through setting up Prometheus and Node Exporter on Linux servers to monitor system performance.
Install Node Exporter
Visit the official Prometheus Node Exporter release page and find the download link for the latest version that matches your operating system. Then, copy the link for use.
# apt-get update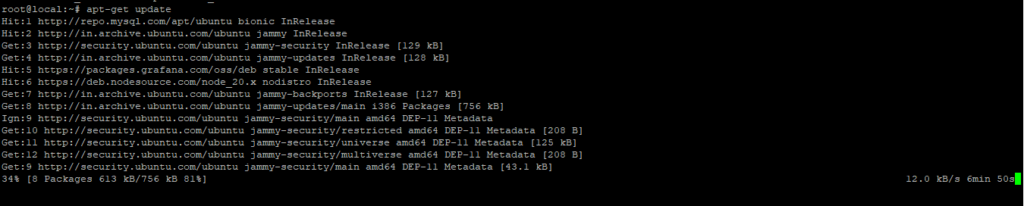
Download Node Exporter
# wget https://github.com/prometheus/node_exporter/releases/download/v1.9.0/node_exporter-1.9.0.linux-amd64.tar.gz
Unzip the downloaded the file
# tar xzfv node_exporter-1.9.0.linux-amd64.tar.gz
Move the binary file of node exporter to /usr/local/bin location
# mv node_exporter-1.9.0.linux-amd64/node_exporter /usr/local/bin/
Create a node_exporter user to run the node exporter service
# useradd -rs /bin/false node_exporter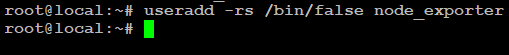
Creating Node Exporter Systemd service
# vim /etc/systemd/system/node_exporter.service
[Unit]
Description=Node Exporter
After=network.target

[Service]
User=node_exporter
Group=node_exporter
Type=simple
ExecStart=/usr/local/bin/node_exporter

[Install]

WantedBy=multi-user.target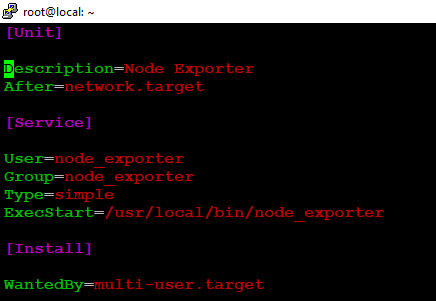
Now lets start and enable the node_exporter service
# systemctl daemon-reload
# systemctl start node_exporter
# systemctl enable node_exporter
# systemctl status node_exporter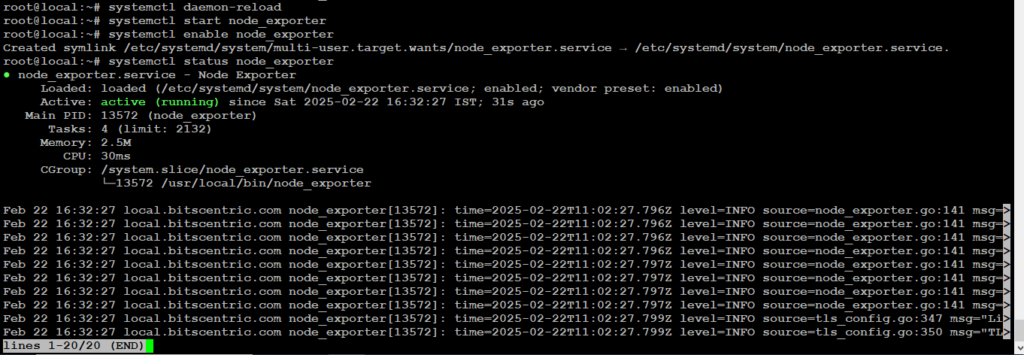
Configure the Node Exporter as a Prometheus target
To get Prometheus to scrape metrics from Node Exporter, we need to update its configuration.
# vim /etc/prometheus/prometheus.yml
- job_name: "Node_Exporter"
    scrape_interval: 5s
    static_configs:
      - targets: ["localhost:9100"]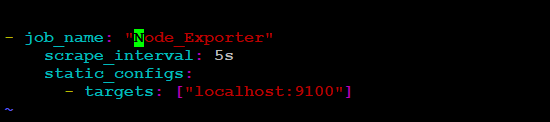
Now restart the Prometheus Service
# systemctl restart prometheus
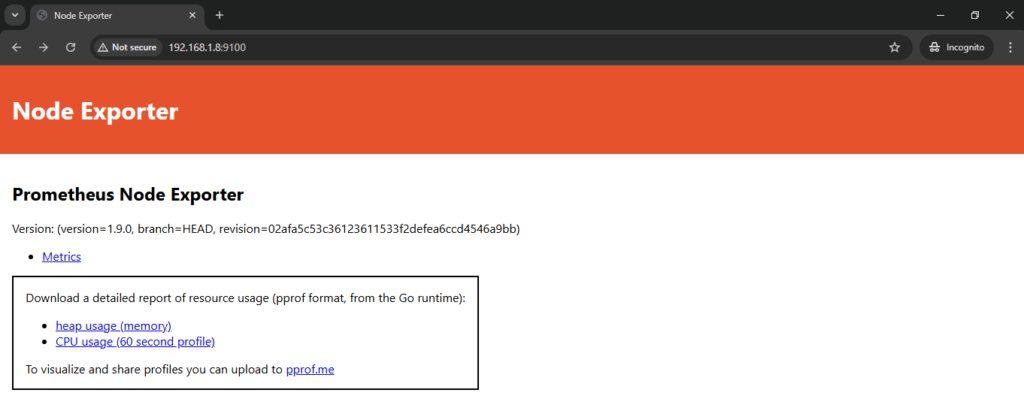
# systemctl restart node_exporter.serviceOpen your preferred web browser and enter the server’s IP address
# http://192.168.1.8:9100/