How to Install Grafana on Ubuntu 22.04
Grafana is a powerful open-source tool for monitoring and visualizing data. Created by Torkel Ödegaard in 2014, it has become a go-to solution for tracking and analyzing time-series data from different sources. Its flexibility, ease of use, and ability to integrate with various systems make it a favorite for monitoring infrastructure, applications, and IoT devices.
Add Grafana Repository
# apt install gnupg2 apt-transport-https software-properties-common wget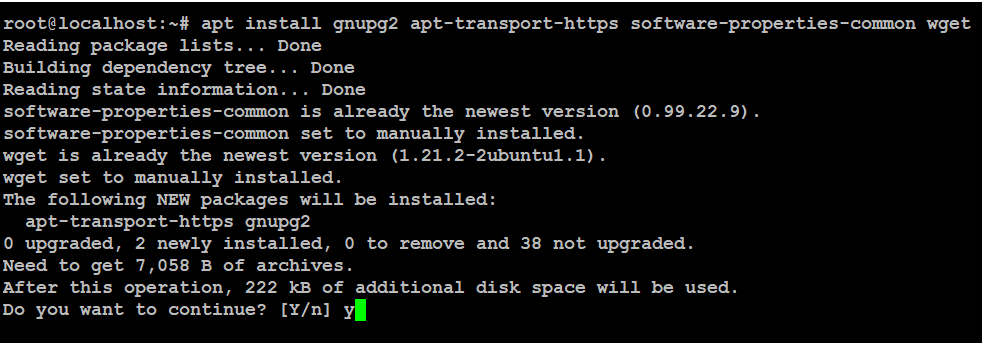
Next, download and add the Grafana GPG key.
# wget -q -O - https://packages.grafana.com/gpg.key > grafana.key
cat grafana.key | gpg --dearmor | tee /etc/apt/trusted.gpg.d/grafana.gpg > /dev/null
Then, add the Grafana repository to your APT source file.
# echo 'deb [signed-by=/etc/apt/trusted.gpg.d/grafana.gpg] https://packages.grafana.com/oss/deb stable main' | tee /etc/apt/sources.list.d/grafana.list
Next, update the repository
# apt update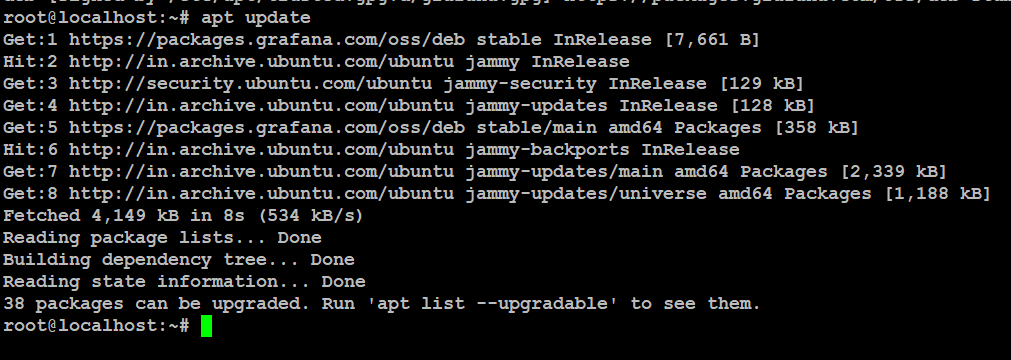
Install and Configure Grafana
Now you can install Grafana
# apt install grafana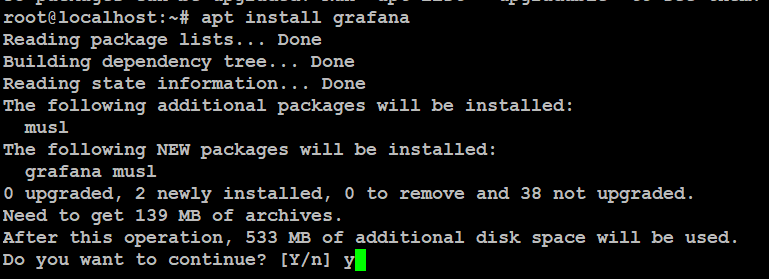
Once Grafana is installed, reload the systemd daemon.
# systemctl daemon-reloadNext, start the Grafana service
# systemctl start grafana-server.service
# systemctl enable grafana-server.service
# systemctl status grafana-server.service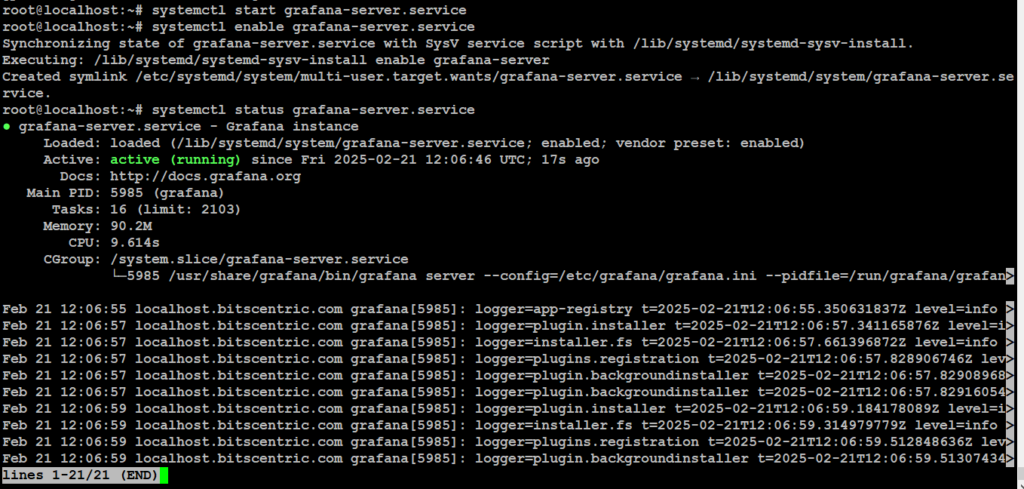
To access the Grafana dashboard, open your preferred web browser and enter the server’s IP address or hostname, followed by the default Grafana port: 3000.
# http://your_ip:3000
# http://192.168.1.8:3000/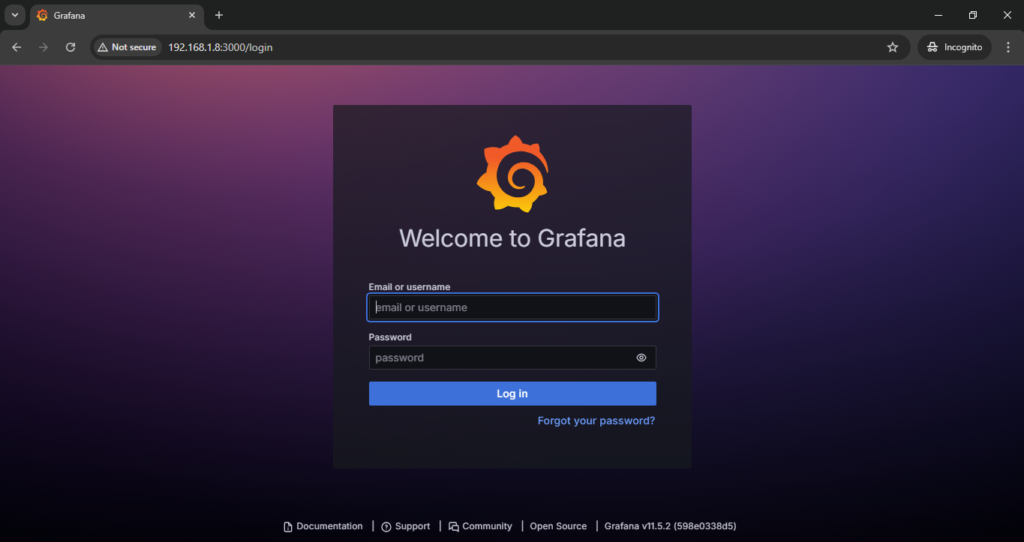
Here is the login page for Grafana. Please log in using the default username and password provided below.
# Username – admin
# Password – admin
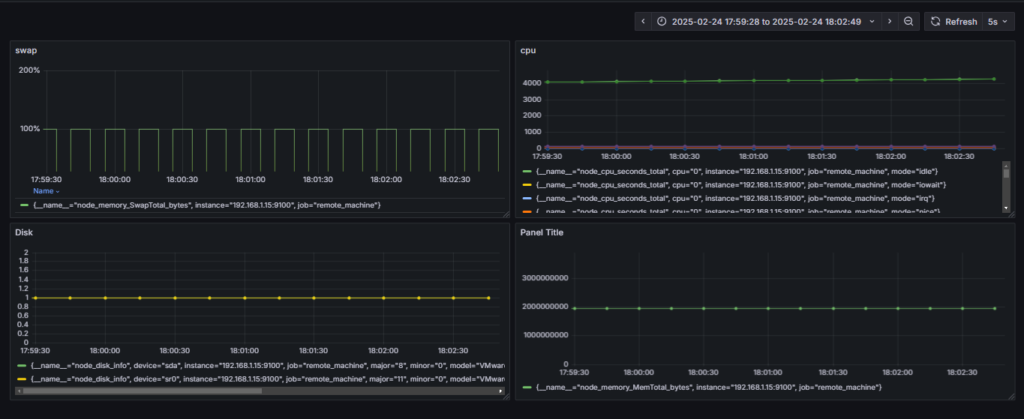
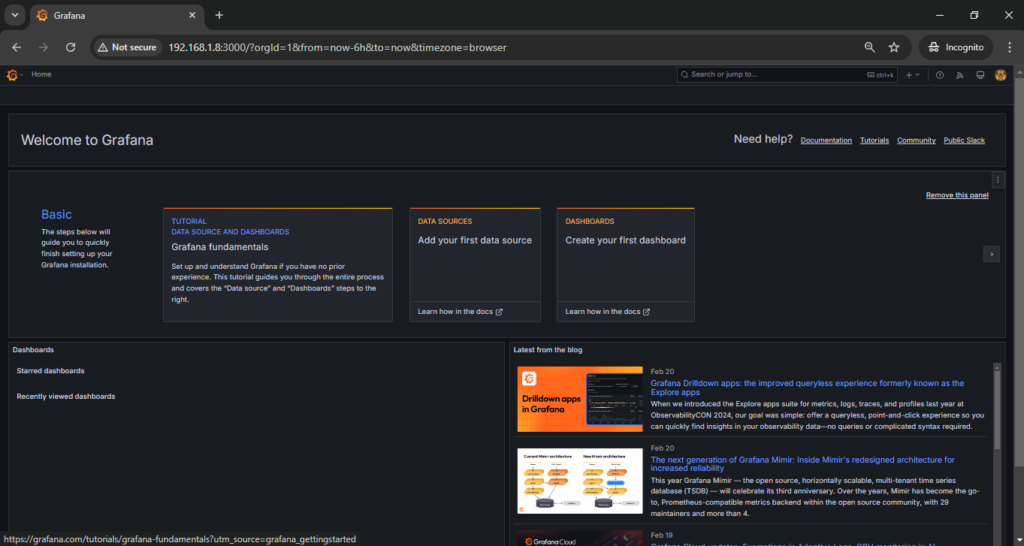
Here is the Home Dashboard page of Grafana.
Client machine monitoring